How do you know the performance of your React Native app is good? Or, say you’ve implemented a fix and it might “feel” more fluid, but can you be scientifically sure those changes did improve performance?
Flashlight 🔦 was built for this. It’s a tool to measure performance of any Android app (though iOS support is on the way) aggregating different performance metrics.I’ll show you how to use it on a simple example app: a Netflix React Native clone.
Example scenario: measuring React Native FlatList vs FlashList scrolling performance
The example app: a Netflix React Native clone
Let’s take a simple app as an example: our main screen displays a vertical list composed of horizontal lists of movie pictures (all coming from TMDB)
Since FlashList, Shopify's component to display performant lists, came around, it'd be interesting to verify: is FlashList really better than FlatList for our app?
But this article should really illustrate how to use Flashlight to assert whether your code changes improved performance or not.It could be
- switching from
FlatListtoFlashList - switching to the new architecture
- adding some memoization
- ...
Looking at the code of our React Native app
Essentially our vertical list looks like this:
const App = () => {
  const playlists = require("./api/data/rows.json");

  return (
    <FlatList
      data={playlists}
      keyExtractor={(playlist: Playlist) => playlist.id}
      renderItem={({ item: playlist }: { item: Playlist }) => (
        <MovieRow playlist={playlist} />
      )}
      contentContainerStyle={listStyles.container}
    />
  );
};
and our rows look like:
const MovieRow = memo(({ playlist }: { playlist: Playlist }) => {
  const movies = playlistData[playlist.id]();

  return (
    <>
      <Text numberOfLines={1} style={rowStyles.title}>
        {playlist.title}
      </Text>
      <View style={rowStyles.container}>
        <FlatList
          contentContainerStyle={rowStyles.listContainer}
          keyExtractor={(movie: Movie) => movie.id.toString()}
          ItemSeparatorComponent={MarginBetweenItems}
          horizontal
          data={movies}
          renderItem={({ item }: { item: Movie }) => (
            <MoviePortrait movie={item} />
          )}
        />
      </View>
    </>
  );
});
You can check out the full code here
Switching from FlatList to FlashList
Switching to FlashList is simple enough:
- change a few letters Fla t List ➡️ Fla sh List
- we need to add
estimatedItemSizeto the lists, whichFlashListconveniently suggests for you - memoizing the items was essential with
FlatList(you can see why in this FlatList optimization exercise) but no need withFlashList

The full diff is available here, quite small right?
How does FlashList use recycling for better performance? ♻️
Unlike FlatList, FlashList uses recycling.
Basically items do not get unmounted-remounted anymore, instead items disappearing from the screen are reused for new items appearing by changing their prop.
In the example above, when we scroll down:
- with FlatList's virtualization, item 3 gets unmounted, item 6 gets mounted
- with FlashList's recycling, item 3 gets new props and becomes items 6!
You can get unintended side effects though. I shared a fun one I faced at the end of the article.Be sure to check the docs on how to make the most of it.
What about WishList?
Side note, another list component is also coming: WishList by Margelo. When it comes around, I’ll update this article or post a new one to compare with FlatList and FlashList.
Comparing performance with your naked eye
To efficiently compare performance, we should try the app on a low end Android device with __DEV__ mode disabled (see here to do it with Expo)
However, on the naked eye, there isn't necessarily a massive difference. This is where Flashlight comes in.
Flashlight aggregates performance metrics (FPS, CPU usage, RAM usage) and gives you a performance score, so that you can answer the question: is the performance of my app good?
Let's see how to use it with three different ways, each with their benefits:
- flashlight measure: quickly measure and compare Android performance
- flashlight test: automating Android performance measures
- flashlight cloud: automated Android Performance measures in the Cloud or CI
1. flashlight measure: quickly measure and compare Android performance
First performance measures
The easiest way to get started with measuring performance is to install flashlight:
macOS/Linux
curl https://get.flashlight.dev | bash
Windows
iwr https://get.flashlight.dev/windows -useb | iex
Then:
- open the app on your device/emulator
- run
flashlight measureand it will measure the performance of what you do in the app:
The score depends on what you do during the measures and the duration of measures. For instance, If you do nothing, your score should be close to 100! (unless you have major performance issues).
In our case, ouch, pretty bad score. Seems like the main reason is a "high CPU usage per thread", what does this mean? 🤔
What are CPU threads in the context of Android development? 🤔
Smartphones have multiple CPU cores—often between 4 and 8—which enable them to run multiple threads in parallel. (For a deeper understanding, you can check out this article).
In Android apps, the UI thread is dedicated to rendering the UI smoothly, aiming for at least 60 Frames Per Second (FPS). It also handles user interactions like button presses. If the CPU usage for this thread nears 100%, it's a sign that it's overwhelmed, leading to a laggy user experience, such as choppy scrolling.
React Native apps have a similar structure but add a JS thread to the mix. This thread handles JavaScript logic and forwards rendering updates to the UI thread. High CPU usage on the JS thread—around 100%—will result in poor responsiveness. For example, onPress events may experience delays or fail to trigger.
What to look for in the performance report for React Native developers?
Well obviously the score to start with! It's here to aggregate the different metrics and give you an easy-to-follow performance indicators.
However, React Native developers should be also interested in:
- the FPS graph, which should stay close to 60
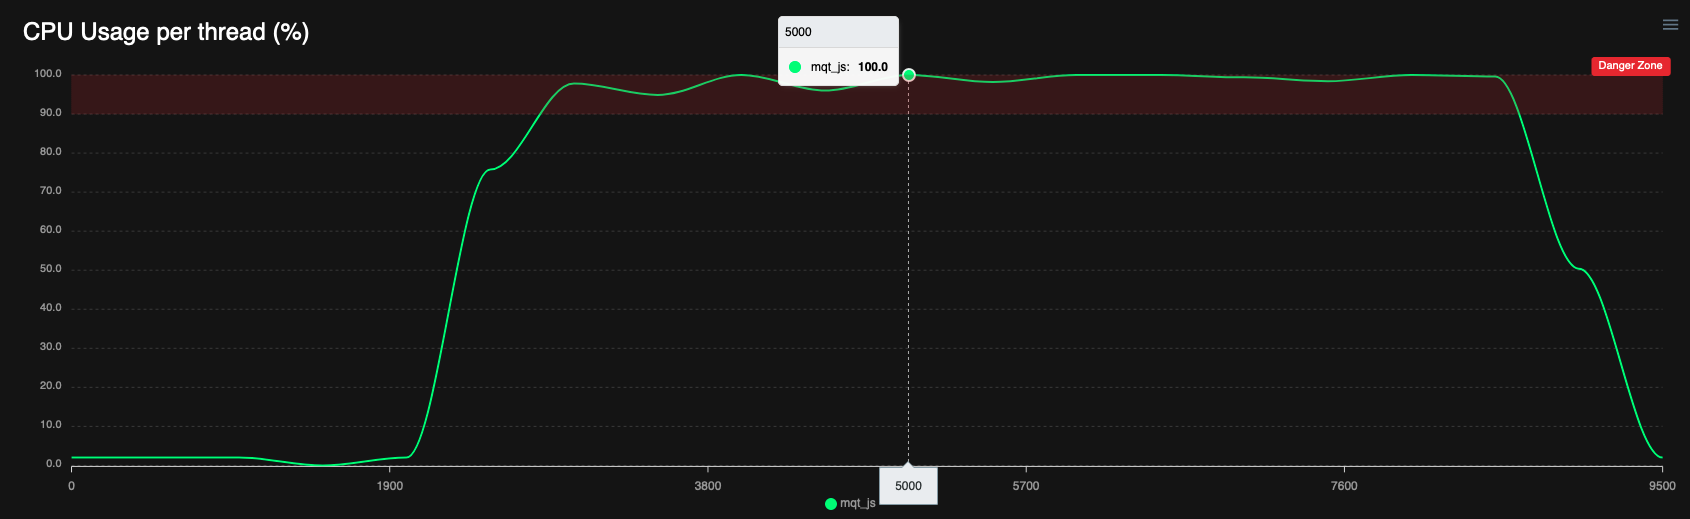
- the CPU per thread graph, especially the
mqt_jsthread, which is the name of the JS thread on Android
Your goal should be to ensure that the JS thread doesn't appear in the Processes with high CPU usage section.
In fact, your goal should be that nothing appears there, in addition to having your average FPS close to 60.
So in our case, our score is indeed pretty bad, because the JS thread is saturating for a while, meaning our app will be lacking responsiveness when scrolling.
Comparing performance measures after making a change
flashlight score heavily depends on the duration of measures. So when comparing measures, it’s important to measure for the same amount of time.
So to compare performance, we need to follow these steps:
- click “Start measuring”
- scroll in our app
- wait for exactly 10s to elapse
- click “Stop measuring”
Let’s do it once with the code using Flatlist, then we can do it again after switching to Flashlist and reloading (or rebuilding the app)
Pretty substantial gains right? 🥳
It’s worth noting there’s no correlation between FlashList and Flashlight, except a lot of letters 😅 and the fact that using FlashList should improve your Flashlight score 💪
2. flashlight test: automating Android performance measures
With flashlight measure, we were able to see easily that switching to FlashList has massive performance benefits in our case. But this approach could be optimized:
- This process can become annoying, especially if you want to quickly iterate on performance fixes and measure your changes
- performance measures are not deterministic, so chances are your
flashlightscore will vary if you repeat the same measures.
Automate scrolling gesture
To make the process less annoying and more deterministic, let’s start by automating our scrolling, we can easily script a scroll gesture on Android using adb shell input swipe :
adb shell input swipe <x1> <x2> <y1> <y2> <duration> will swipe from point (x1, x2) on the screen to point (y1, y2). duration controls the duration of the swipe movement, so the lower, the faster the scrolling will be
On my phone, adb shell input swipe 500 700 500 300 50 works well for a scroll down. Our steps become:
- click “Start measuring”
- Run
adb shell input swipe 500 700 500 300 50 - wait for exactly 10s to elapse
- click “Stop measuring”
That's already a bit better! But that's too many clicks for me 😅I find it still annoying especially when I want to quickly measure different performance fixes (possibly, I’m lazy).
Luckily, we can automate all those steps with flashlight test
Using flashlight test
Given a test script to do things in our app (like our adb shell command), we can use flashlight test by passing as a testCommand parameter:
flashlight test --bundleId com.movielist \
  --testCommand "adb shell input swipe 500 700 500 300 50" \
  --duration 10000 \
  --iterationCount 1 \
  --skipRestart \
  --record
Ok, that’s a big list of parameters, let’s explain:
bundleIdis your app bundle id or app id. You can find it withflashlight tools android_get_bundle_iddurationtells Flashlight to measure for 10s (VERY important to keep the same when comparing measures)iterationCount: I’ve mentioned that performance measures are not deterministic. This is why by default,flashlight testwill run 10 iterations of the test command and average the result. This should help in having more deterministic measures.
But to quickly check your changes had an impact, you can limit the number of iterations with--iterationCount 1for instance, especially if the impact is clear--skipRestart: by default, Flashlight closes the app before each iteration. This is useful if your test command starts the app, but in our case it doesn’t so we add this to keep the app open.--record: records a video while measuring (this one is a bit experimental still)
At the end of it, a json of measures is created, you can run flashlight report <...>.json to open the web report similar to what we had with flashlight measure 🥳.
Comparing automated performance measures
If you have several measure files, you can open the comparison view by running flashlight report first.json second.json
In our case, let’s generate 2 json of measures:
- one for
FlatList:
flashlight test --bundleId com.movielist \
  --testCommand "adb shell input swipe 500 700 500 300 50" \
  --duration 10000 \
  --iterationCount 1 \
  --skipRestart \
  --record \
  --resultsFilePath flatlist.json --resultsTitle "FlatList"
- let’s reload after switching to
FlashListand generate a new json:
flashlight test --bundleId com.movielist \
  --testCommand "adb shell input swipe 500 700 500 300 50" \
  --duration 10000 \
  --iterationCount 1 \
  --skipRestart \
  --record \
  --resultsFilePath flashlist.json --resultsTitle "FlashList"
- Now you can run:
flashlight report flatlist.json flashlist.json
and get the comparison view 🥳

Using flashlight test with Maestro end-to-end test
We can be a bit more thorough with our measures.
For instance:
- let’s take into account the performance of the list appearing
- we should make sure our tests are actually scrolling to the same spot
- For instance, if our test was only scrolling half a screen for FlashList and two whole screens for FlatList, of course, the performance should be better with FlashList 😅
- one way to ensure we're scrolling to the same place is simply to scroll to the bottom
- let’s run for several iterations this time to have a more deterministic accurate score
We could probably get by with simple adb commands, but using a Maestro end-to-end test would be easier.
At BAM, we love Maestro for e2e testing and wrote about it in our tech radar. Installing it is simple, and creating a test to quickly scroll to the bottom of our list is easy-peasy!
Basically, we just have to create a scroll.yml file describing what we want to do in our app, for instance:
appId: com.movielist # Replace with your app id
---
- launchApp
- assertVisible: .*Family.*
- scroll
Running maestro test scroll.yml will
- open the app
- ensure the app is properly started with a text containing “Family” appearing on screen
- scroll down
If you try this out, you might notice the scrolling isn’t very fast. We can use swipe instead of scroll and play with the parameters:
appId: com.movielist # Replace with your app id
---
- launchApp
- assertVisible: .*Family.*
- swipe:
    start: 50%, 90% # From (50% of width, 90% of height)
    end: 50%, 10% # To (50% of width, 10% of height)
    duration: 200 # Swipe takes 200ms, decrease to scroll faster
We can now repeat the scrolling to ensure we’ve scrolled to the bottom using repeat:
appId: com.movielist
---
- launchApp
- assertVisible: .*Family.*
- repeat:
    times: 5 # Repeat enough times to scroll to the bottom
    commands:
      - swipe:
          start: 50%, 90% # From (50% of width, 90% of height)
          end: 50%, 10% # To (50% of width, 10% of height)
          duration: 200 # Swipe takes 200ms, decrease to scroll faster
maestro test scroll.yml should now open the app, and quickly scroll 5 times, which should be enough for our app to scroll to the bottom.
Now we can reuse this to get performance measures by running flashlight test with --testCommand "maestro test scroll.yml".
Since the test takes a bit less than 30s in my case, let’s set --duration 30000 this time
flashlight test --bundleId com.movielist \
  --testCommand "maestro test scroll.yml" \
  --duration 30000 \
  --record
Of course, it should take longer this times, but after running flashlight report on both reports, you should be more certain which case has the best performance 💪
3. flashlight cloud: Automated Android Performance measures in the Cloud or CI
That takes a few minutes though, right? Also if you want to compare measures between different members in your team, you have to ensure they’re on the same phone!
This is why flashlight also has a cloud version (totally free!! at least, for now), always running on the same low end Android device (a Samsung Galaxy A10s by default)
To use it, create your API key here and set it as an environment variable:
export FLASHLIGHT_API_KEY="fl_xxxxx"
Then you can use your Maestro test file as easily as this:
flashlight cloud --test scroll.yml --duration 30000 --app apks/flashlist.apk
Run it with both your APKs (before fix and after fix), then open https://app.flashlight.dev/test-list, select the 2 last reports and hit compare!
In my case this is what I get:
You can also check out the full comparison report here
Easy to see who the winner is, right? 🥳
Conclusion: how to measure performance of your React Native app with Flashlight
Let’s summarize a bit:
Tips to efficiently measure performance:
- Measure with a release version of your app (or at least in
__DEV__mode) - Use a low end Android device
- Run several iterations in the same conditions
Which flashlight command should I use

measure Quickly check performance bottlenecks in your app

test Automate performance measures for faster iterations or more thorough measures

cloud Do it all in the cloud on a real low-end Android device 😎
You can also check out how Thomas used flashlight to measure Hermes vs JSC app startup performance in this article
How to know if the performance of my app is good
React Native developers should be particularly interested in:
- the FPS graph
- the CPU per thread graph, especially the
mqt_jsthread, which is the name of the JS thread on Android
Your goal should be to ensure that the JS thread doesn't appear in the Processes with high CPU usage section.
In fact, your goal should be that nothing appears there, in addition to having your average FPS close to 60.
Questions/Thoughts/Challenges?
We had so many things to talk about! 😅
If you have any questions or just want to talk about performance, feel free to reach out on Twitter, Github or Flashlight's Slack 🤗
Appendix 1: an unintended side-effect of recycling nested lists
I’ve mentioned recycling can have unintended side effects.I actually got one myself: when rows get recycled, they keep their scroll position and momentum 😅
Remember how recycling works? If our items are scrollable lists, then when item 3 gets recycled into item 6, it will keep scroll position and momentum of when it was actually item 3 🤯
In my case, this produced something like this: I scroll the first line to the right. But when I scroll down, it gets recycled and I see another line scrolling.
The solution is to reset the scroll offset every time a new row appear, with a hook similar to this.
However, we also need this PR to land in React Native to make it fully work 🤞
Appendix 2: How does Flashlight compare with the Performance Monitor Flipper Plugin?
If you’ve read my previous article about measuring performance, you might be wondering how Flashlight compares with the Performance Monitor Flipper plugin.
flashlight measure aims to replace https://github.com/bamlab/react-native-flipper-performance-monitor. It is superior in a lot of ways:
- it works in production
- no need to install it, no need for Flipper
- you get more metrics out of the box (RAM, all CPU threads…)
However:
- iOS support is still in progress
- JS FPS isn’t directly reported, but JS CPU usage is instead, which is correlated:
- 0% JS thread CPU Usage ↔️ Max JS FPS
- 100% JS thread CPU Usage ↔️ 0 JS FPS0 JS FPS ↔️ 100% CPU usage

